Address
Nanlang Industrial Zone, Xingtan Town, Shunde District, Foshan, Guangdong, China
Work Hours
Mon–Fri, 9:00 AM – 6:00 PM (CST/UTC+8). We aim to respond to all inquiries within 48 hours.

Address
Nanlang Industrial Zone, Xingtan Town, Shunde District, Foshan, Guangdong, China
Work Hours
Mon–Fri, 9:00 AM – 6:00 PM (CST/UTC+8). We aim to respond to all inquiries within 48 hours.
Textile Supply Chain Disruption: Risks & How Buyers Build Resilience. This guide covers key properties, real-world applications, and a practical sourcing checklist for B2B buyers.
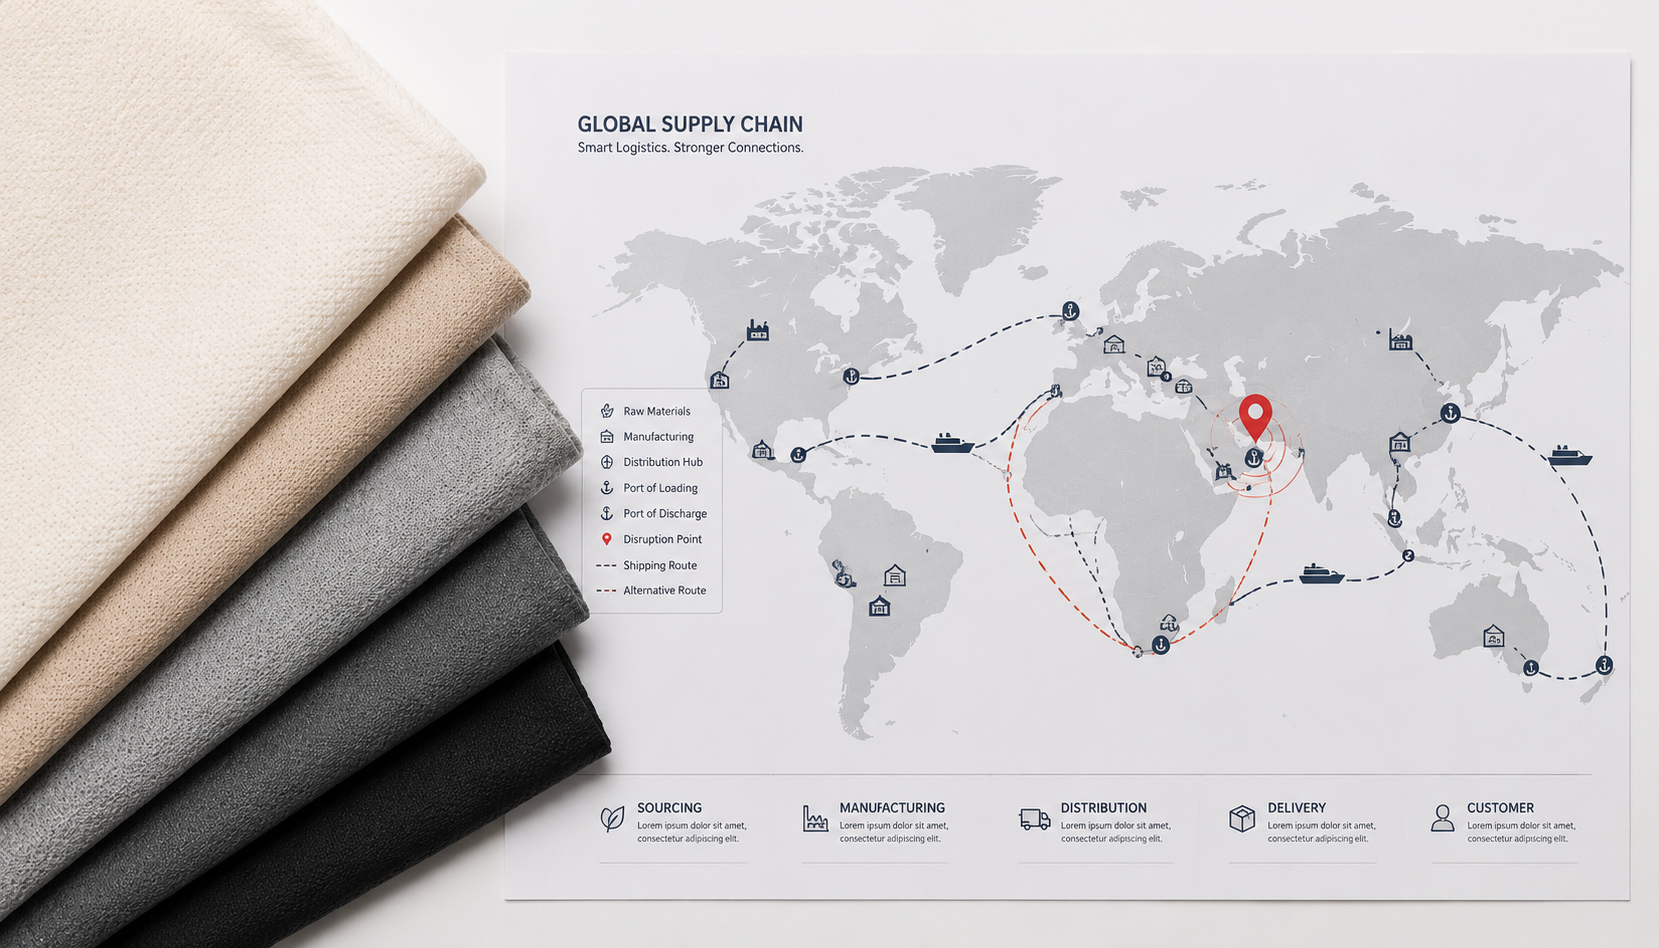
When Suez Canal blockages and pandemic-era port congestion cost the global textile sector an estimated $120 billion in delayed shipments in 2021 alone, most small-to-mid buyers discovered their sourcing playbooks were written for a world that no longer exists. This guide distills two decades of factory-floor experience into a risk map, a resilience SOP, and a decision matrix every B2B textile buyer can act on today.
Buyers hear “supply chain risk” thrown around so often it almost stops meaning anything. Let’s fix that. Understanding textile supply chain disruption risks starts with recognizing that not all threats are created equal — and the consequences buyers underestimate tend to be the ones that hurt most.
Think of supply chain risk as three concentric rings, each hitting your bottom line differently.
Each layer compounds the others. A macro-level port shutdown (layer one) triggers freight rate spikes (layer two), which pressure your supplier into cutting corners on quality control (layer three). You don’t hit one layer at a time — you hit all three simultaneously, usually on a Friday afternoon.
If 2021 showed us the fragility of logistics, 2022 hammered home the volatility of inputs. Cotton futures surged past $1.50/lb — a 10-year high — while European energy costs spiked 300–400 % year-over-year, devastating dyeing and finishing operations that rely on gas-fired machinery. The textile supply chain disruption risks of 2022 taught buyers a brutal lesson: even if your goods physically arrived, the cost had shifted beneath your feet mid-transit.
Downstream garment brands suddenly faced suppliers invoking price-escalation clauses buried in contracts nobody had reviewed in years. Margins didn’t erode gradually. They collapsed, quarter by quarter.
When someone asks “What are the consequences of supply chain disruption?”, the obvious answers come first: delays, surcharges, lost sales. But the real damage runs deeper — and hits faster — than most procurement teams anticipate.
| Consequence | Typical Cost Impact | Detection Speed | Mitigation Difficulty |
|---|---|---|---|
| Air-freight surcharge to recover timeline | 3–5× ocean freight cost | Immediate | High (capacity scarcity) |
| Deadstock from late arrival / off-season delivery | 40–70 % of order value | 3–8 weeks | Very high |
| Retailer chargeback penalties | $5,000–$50,000 per incident | 30–60 days | Contractual (difficult to dispute) |
I’ve seen mid-market EU home-textile brands absorb six-figure chargebacks from a single missed delivery window. The penalty itself stings, but the damaged buyer-retailer relationship is the real long-game loss.
A European home-textile brand importing cotton-poly blends from Shaoxing committed to a Q4 retail launch — 8,000 m (8,749 yd) across five SKUs. Their primary mill’s dye-chemical supplier faced a 6-week shortage in late 2022, stalling production entirely.
The brand scrambled. Spot-market supplier number one failed an OEKO-TEX audit on formaldehyde levels — non-negotiable for EU retail. Spot supplier number two delivered an acceptable lab dip but couldn’t replicate shade consistency across the full 8,000 m (8,749 yd) bulk run; batch-to-batch ΔE exceeded 1.5, which would have triggered retailer rejection at goods-in.
The compromise: a 12-day delay, a 60/40 order split between the original mill (which resumed partial production) and a pre-vetted backup, and a 7 % cost premium the brand absorbed by narrowing the launch SKU range. Not a perfect outcome. But they hit the retail floor — barely — and documented every step so the next disruption wouldn’t require reinventing the wheel.
Understanding what are the risk factors in the textile industry means looking beyond headlines. Every stage of the textile value chain — from fiber sourcing to final delivery — carries its own disruption profile. The matrix below maps the most significant threats so you can prioritize where to build defenses.
Fiber prices are the heartbeat of textile sourcing cost, and that heartbeat is erratic. Cotton futures have swung 40–65 % within a single calendar year twice since 2020. Polyester isn’t immune either — PTA/MEG feedstock tracks crude oil pricing, which means Middle East tensions ripple into your synthetic fabric quotes within weeks.
| Fiber Type | Price Volatility Index (3-yr avg.) | Primary Origin Risk | Substitution Ease |
|---|---|---|---|
| Cotton (Upland) | ±38 % | India, Pakistan, Central Asia | Moderate |
| Polyester Staple | ±22 % | China, India (PTA/MEG linked) | High |
| Nylon 6/66 | ±28 % | China, EU (caprolactam) | Low–Moderate |
| Viscose/Rayon | ±31 % | Indonesia, China (pulp) | Moderate |
| Specialty (Nomex, Tencel) | ±45 % | Single-license producers | Very Low |
For commodity synthetics, substitution is relatively straightforward. But specialty fibers — those with specific flame-retardant or moisture-management properties — can lock you into a single global supplier for months. That’s a risk vector most buyers don’t map until it’s already firing.
Ocean freight has always been the hidden variable in textile profitability. The shift from “just-in-time” to “just-in-case” inventory didn’t happen because someone read a management book — it happened because Shanghai-to-Rotterdam transit times inflated from 28 days to 42 days (effectively an 1,100 to 1,600 nautical mile reroute under congested conditions) and spot rates hit $14,000 per 40 ft container in 2021, compared to a 2019 baseline of $1,500.
The WTO’s World Trade Statistical Review documents how textile trade volumes contracted by 5 % even as demand stayed flat — the gap was entirely logistics-driven. Buyers who assumed “it’ll normalize next quarter” kept waiting while their competitors secured alternative routing and locked in capacity contracts.
Regulatory disruption is insidious because it looks, on the surface, like a paperwork issue — until 20,000 m (21,872 yd) of finished fabric sits in a Rotterdam warehouse because one chemical on the EU REACH SVHC Candidate List was detected above threshold in a third-party audit.
The 2023 expansion of that SVHC list added substances common in textile water-repellent finishes. The Uyghur Forced Labor Prevention Act (UFLPA) added documentary burdens to cotton supply chains running through Xinjiang. And the EU’s Digital Product Passport initiative — more on that later — will soon require granular traceability data that many mid-tier mills simply cannot produce today.
Compliance gaps don’t just trigger delays. They can permanently disqualify a supplier from your approved-vendor list, leaving you scrambling for alternatives at premium pricing.
Not every disruption comes from far away. Mill-level failures account for a significant percentage of textile supply chain disruption risks, and they’re the hardest to predict from a distance.
This is precisely where vertical integration earns its premium. A manufacturer with a consolidated weave-to-dye-to-flock production chain and a 2,000 m² (21,528 ft²) finished-goods warehouse isn’t just more efficient on a good day — they’re dramatically more resilient on a bad one, because a single operational hiccup doesn’t cascade across three outsourced processing stages.
Reading a textile supply chain disruption risks PDF is educational, but it doesn’t protect your next PO. What protects your next PO is a structured, repeatable Standard Operating Procedure you execute before problems surface — not after. Here’s a four-step framework I’ve refined across dozens of sourcing programs.
Before you sign anything, score your suppliers against a weighted model. Here’s the one we recommend:
| Criterion | Weight | Supplier A Score | Supplier B Score |
|---|---|---|---|
| Financial stability | 25 % | 80 | 55 |
| Certification portfolio (OEKO-TEX, ISO, GRS) | 20 % | 90 | 60 |
| Geographic diversification (ports, backup mills) | 20 % | 60 | 50 |
| Lead-time flexibility (buffer stock, MOQ range) | 20 % | 70 | 65 |
| Communication responsiveness | 15 % | 60 | 50 |
Supplier A scores a weighted 72. Supplier B scores 58. On paper, both can produce your fabric. In practice, Supplier A’s certification depth and financial stability make them meaningfully more resilient under stress. That gap widens dramatically during a disruption event.
One nuance worth noting: responsiveness scores should be based on actual interaction data — email response times, technical query resolution rates — not brand reputation. I’ve sourced from famous-name mills that took 72 hours to reply to an urgent QC question.
The 70/30 split — 70 % of volume from your primary supplier, 30 % held as backup capacity at a pre-vetted secondary — is the single most effective structural defense a mid-market buyer can deploy. But it requires real trade-off decisions.
Contracts aren’t just legal formalities — they’re your risk-transfer instrument. Three clauses matter more than anything else in textile sourcing:
Force majeure with textile-specific language. Generic force majeure covers natural disasters. It should also explicitly address raw-material price spikes above a defined threshold (e.g., fiber index +20 %), port closures, and regulatory changes that alter your product’s compliance status mid-production.
Penalty escalation schedules tied to delivery milestones, not just the final ship date. If your supplier misses the dye-lot approval deadline, that’s where cascading delays start — and that’s where penalties should activate.
Payment structure as risk leverage. The standard T/T 30/70 (30 % deposit, 70 % upon B/L copy) gives you meaningful leverage. For orders above $5,000, L/C at Sight adds a bank-verification layer that filters out undercapitalized suppliers. Some buyers treat payment terms as a cost negotiation; smart buyers treat them as a risk screen.
You can’t manage what you don’t measure. Set up a weekly cadence that includes freight-rate alerts (Shanghai Containerized Freight Index is the standard benchmark), raw-material index tracking, and a direct supplier check-in — not just “how’s production?” but “show me photos of current WIP stage.”
A practical traffic-light system keeps trigger points simple:
The key is pre-agreeing these thresholds with your team before emotions enter the picture. Hesitation during a Red event costs real money. If you want to stress-test your current sourcing program against this framework, submitting your technical spec sheets to a manufacturer for a feasibility assessment — which can be turned around within 48 business hours — is a low-risk way to validate whether your backup supplier pipeline is actually functional.
The textile supply chain disruption risks of 2021 hit differently depending on where your goods were in the pipeline. This case — drawn from a real trajectory, though with some details anonymized — shows what happens when a production-ready order meets a sudden logistics crisis, and why integrated manufacturing capacity matters more than anyone admits until they need it.
A North American promotional-products distributor had placed a 15,000 m (16,404 yd) order for flocked-on-nonwoven-base material — a polyester nonwoven substrate with nylon/polyester electrostatic flock fiber surface, typically weighing approximately 135 gsm (4.0 oz/yd²) at 150 cm (59″) width. The material was OEKO-TEX Standard 100 certified and EU REACH compliant, both of which were non-negotiable requirements from the end-client.
Production was on track. Then August 2021’s typhoon season hit. The designated export port — Shenzhen — experienced a 9-day partial terminal closure. Suddenly, 15,000 m (16,404 yd) of finished goods were stranded in a warehouse 70 km (43 mi) from a port that couldn’t ship them.
The buyer, the manufacturer, and the freight forwarder convened an emergency call. Three options emerged:
None of these options was cost-neutral. The question was which trade-off the business could absorb.
Here’s where the story diverges from what happens at a typical trading company. The manufacturer had completed roughly 80 % of the order — 12,000 m (13,123 yd) — and held it in a dedicated 2,000 m² (21,528 ft²) finished-goods warehouse. The production lines (weaving, dyeing, and flocking all under one roof) had compressed the manufacturing timeline, which meant the goods were genuinely ready and not mid-process.
The compromise: reroute the first 5,000 m (5,468 yd) via Guangzhou FOB immediately. Air-freight a 500 m (547 yd) emergency sample-and-initial-launch batch. The remaining 9,500 m (10,389 yd) waits for Shenzhen to reopen. Total logistics premium: approximately 15 % above the original FOB budget.
The product launch happened on time — technically a few days early, since the air-freighted batch arrived before the sea shipment. The distributor swallowed a meaningful logistics hit but preserved the retail relationship and the full margin on the sale itself.
Not every buyer needs a four-supplier global diversification strategy. But every buyer needs the right strategy for their specific risk profile. What are the risk factors in the textile industry that should drive your archetype selection? Here’s a practical framework.
| Archetype | Risk Tolerance | Typical Order Size | Recommended Buffer Strategy |
|---|---|---|---|
| Single-Source Optimizer | Low risk environment, commodity product | 500–2,000 m (547–2,187 yd) | Safety stock at supplier (2–4 weeks) |
| Dual-Source Balancer | Moderate risk, mixed complexity | 2,000–10,000 m (2,187–10,936 yd) | 70/30 primary/backup split |
| Near-Shore Hedge | High risk tolerance for cost but speed-sensitive | 1,000–5,000 m (1,094–5,468 yd) | Domestic/regional backup for critical SKUs |
| Multi-Region Diversifier | Low risk tolerance, high compliance needs | 10,000+ m (10,936+ yd) | No single region > 50 % of total volume |
Your archetype isn’t a personality label — it’s a structural decision that cascades through every PO you write. Getting it wrong is expensive. Getting it right is invisible, which is exactly how good sourcing strategy should feel.
A commodity 100 % polyester knit, sourced from dozens of mills across three continents? Single-Source Optimizer is probably fine. The risk of total supply failure is low and the cost premium of over-diversification wipes out your margin.
Now consider a specialty flocked-on-nonwoven-base material with dual OEKO-TEX and REACH compliance, custom weight specifications, and a specific hand-feel requirement. That product demands a Dual-Source Balancer approach at minimum. Why? Because the certification verification process alone takes 4–6 weeks for a new supplier — and you don’t have 4–6 weeks to waste when your primary supplier goes down.
For buyers navigating these complexity-driven decisions, the technical knowledge hub with guides on fabric testing standards and certification processes is a valuable resource for understanding what compliance verification actually entails before you commit to a sourcing archetype.
The textile supply chain disruption risks of 2022 taught us that upstream shocks cascade fast. But what’s coming next may be more systemic — and slower to recognize — than a cotton-price spike or a port closure.
Extreme weather events are increasing in frequency, and textile supply chains sit squarely in the crosshairs. Cotton-dependent regions — India, Pakistan, West Africa — are experiencing more severe monsoon disruption and drought cycles. Port infrastructure in Southeast Asia faces rising storm-surge risk. Industry modeling projects logistics insurance premium increases of 12–18 % by 2028 specifically for textile shipments.
For buyers, this isn’t abstract. It means your landed cost calculations need a climate-risk buffer that didn’t exist five years ago. And it means sourcing from flood-prone single-site mills carries a risk weighting that your spreadsheets probably aren’t capturing.
The EU’s Digital Product Passport (DPP) initiative will eventually require every textile product sold in the European market to carry a digital record of its production chain — raw material origin, processing chemicals used, energy consumption data, and labor compliance documentation. This is a compliance layer that a surprising number of suppliers are not prepared for.
If your supplier can’t produce the data infrastructure to support DPP, they become a disruption risk not because of what goes wrong at the factory — but because customs will refuse entry. As defined by the European Commission’s proposed framework, DPP compliance will be a condition of market access, not a nice-to-have certification.
Synthetic fiber production capacity is shifting toward Southeast Asia — Vietnam, Indonesia, and Bangladesh are all expanding upstream capacity. For buyers who remain 80 %+ dependent on a single country for fiber supply, this realignment creates a short-term vulnerability window as new supply chains mature and old ones resize.
A practical five-year diversification roadmap looks like this:
This isn’t theoretical. The buyers who started this process in 2020 are noticeably better positioned today than those who waited. For a concrete example of a product range backed by integrated production and multiple certifications, the flocked and printed fabrics category demonstrates how a single vertically-integrated facility can service diverse product requirements while maintaining compliance across EU, North American, and other regulatory environments.
The primary risks include extended lead times — often 2–6 weeks beyond originally quoted delivery — raw-material price surcharges of 8–20 % applied retroactively through escalation clauses, quality inconsistencies that emerge when suppliers are swapped under time pressure, and compliance failures that trigger customs holds or product recalls. Each risk compounds the others; a single delay event can activate three or four secondary consequences simultaneously.
The top five: single-source dependency on a single supplier or region, raw-material price volatility (especially cotton and polyester feedstock), logistics bottlenecks at ports and along key shipping corridors, regulatory compliance gaps that surface during audits or customs inspection, and lack of real-time supplier communication that delays early-warning detection. These factors rarely operate in isolation — a logistics delay combined with a compliance audit can halt an entire shipment, turning a manageable 5-day slip into a 5-week crisis.
Consequences range from direct financial losses — air-freight premiums of 3–5× the ocean rate, retailer chargeback penalties of $5,000–$50,000 per incident — to indirect brand damage including missed retail windows and stockout-driven customer churn. Industry data suggests a single major disruption event can erode 5–12 % of a buyer’s annual margin if no contingency plan exists. The brands that survive aren’t the ones that never face disruption; they’re the ones that have rehearsed their response before it matters.
Look for three concrete signals: vertical integration — weaving, dyeing, and finishing under one roof — which eliminates inter-facility handoff delays; documented certifications including OEKO-TEX, ISO 9001, GRS, and EU REACH compliance, which demonstrate process maturity and reduce compliance-driven disruption risk; and transparent lead-time and MOQ policies with flexible FOB options and maintained ready-stock inventory. A supplier that can shift FOB ports and ship from warehouse stock in 1–3 days is structurally more resilient than a trading intermediary dependent on third-party production schedules.
For evaluating product-level specificity — say, whether a flocked or specialty printed fabric meets your end-market requirements — reviewing the flocked and printed fabrics product range backed by integrated production and certifications is a useful starting benchmark for resilience evaluation.
Supply chain resilience isn’t a policy document you draft once and file away. It’s a living practice — part relationship management, part financial hedging, part operational discipline. The textile supply chain disruption risks that defined 2021 and 2022 didn’t disappear; they evolved. Climate volatility is accelerating. Regulatory complexity is deepening. Geopolitical flashpoints will continue to restructure trade routes on short notice.
The buyers who end the decade with intact margins and strong supplier relationships won’t be the ones who negotiated the cheapest FOB price in a calm quarter. They’ll be the ones who asked hard questions during calm quarters — about their suppliers’ warehouse capacity, their contractual force-majeure language, their backup-source verification cadence — and built the structural defenses that look expensive until the day they aren’t.
Start with one concrete move this week: pull your top five SKUs, map their single-source exposure, and decide what 70/30 looks like for each. If you don’t have a backup answer for even one of those five, that’s your most urgent risk — and the cheapest one to fix before it fixes you.