Address
Nanlang Industrial Zone, Xingtan Town, Shunde District, Foshan, Guangdong, China
Work Hours
Mon–Fri, 9:00 AM – 6:00 PM (CST/UTC+8). We aim to respond to all inquiries within 48 hours.

Address
Nanlang Industrial Zone, Xingtan Town, Shunde District, Foshan, Guangdong, China
Work Hours
Mon–Fri, 9:00 AM – 6:00 PM (CST/UTC+8). We aim to respond to all inquiries within 48 hours.
2026 Textile Tariffs: What Importers Need to Plan For. This guide covers key properties, real-world applications, and a practical sourcing checklist for B2B buyers.
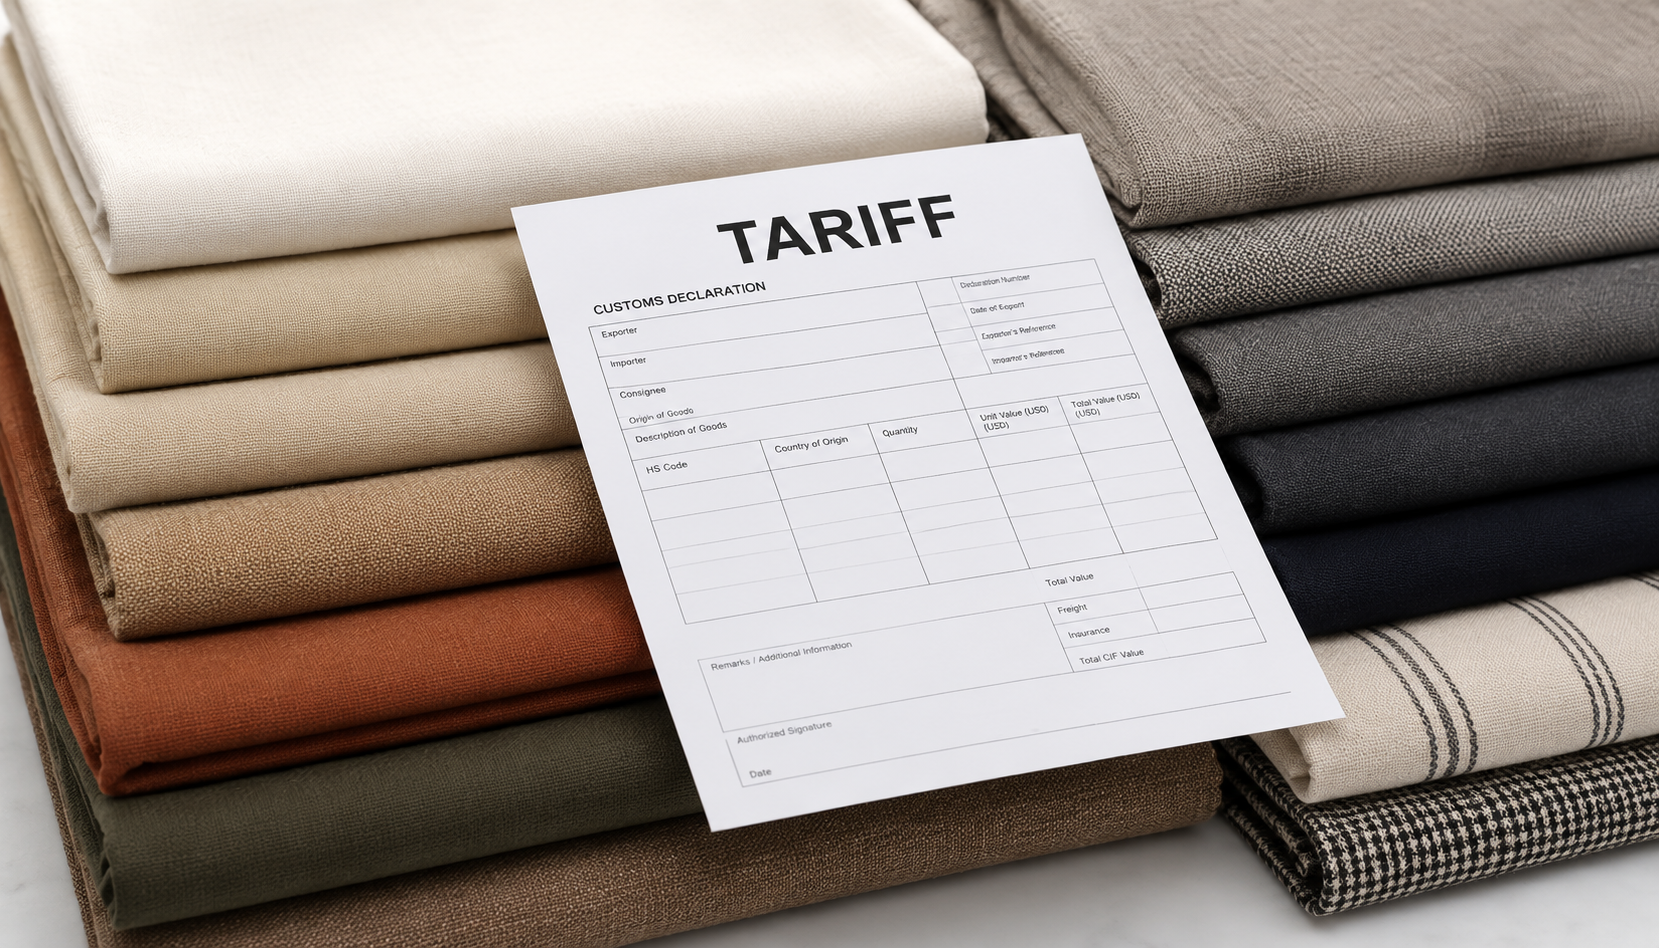
A single HS-code digit reclassification in January 2026 added roughly 18% to one US importer’s landed cost on a 20-foot container (≈6.1 m) of Chinese-origin polyester velvet — the fabric itself had not changed, only its tariff schedule placement. That scenario distils what every textile importer needs to plan for before the next wave of reciprocal and Section 301 adjustments lands on their invoices.
Trade policy in textiles moves in lurches, not smooth curves. Over the past eighteen months, a convergence of legislative deadlines, executive orders, and enforcement expansions has redrawn the duty landscape for anyone importing fabric, yarn, or finished garments into Western markets. For importers evaluating textile tariffs 2026 impact importers in every budget cycle, cataloguing the specific policy events that stacked on top of each other is the essential first step.
Here is what matters most, condensed into a list of the four most consequential actions from late 2025 through mid-2026:
These layers do not stack in a clean, additive way. A fabric that previously cleared customs at 8.0% MFN duty plus 7.5% Section 301 surcharge — a combined 15.5% — now faces 8.0% plus 12.5%, totaling 20.5%. That is a 32% relative increase in the duty component alone, calculated before anti-dumping or countervailing duties even enter the picture. The tariff schedule textile 2026 landscape has become genuinely non-linear.
I should note that the practical sourcing knowledge informing this guide draws on nearly two decades of direct factory experience in the Jiangsu-Zhejiang textile cluster. The XO Fabric company profile documents that production history — integrated weaving and flocking capabilities operating since 2005 — and it carries more operational weight than policy summaries alone.
Total US textile and apparel imports reached approximately $132 billion (≈€122 billion) in recent full-year data. China’s share, once above 35%, has slipped to roughly 28%, while Vietnam climbed to approximately 19% and Bangladesh held near 8%. But those aggregate figures mask a critical detail: China still dominates specialty synthetic fabric segments, commanding upward of 45% share in polyester velvet and high-filament categories. When tariff schedules tighten, the textile tariffs 2026 impact importers most acutely in precisely the product niches where alternative sourcing remains thin.
Most importers fixate on the headline duty rate. That is understandable — it is the biggest, most visible number. But the transmission chain from a tariff schedule line item to the final figure on your shipping invoice involves multiple nodes of cost inflation, each compounding the last. Understanding this cascade is the difference between an accurate landed-cost model and one that catches your finance team off-guard when the bill arrives.
Here is how the chain works in practice: the headline rate applies to the customs valuation basis, which is not just the FOB price of the fabric. Customs valuation typically includes the transaction value plus freight to the port of entry and insurance. Once that base is established, additional layers stack on top — anti-dumping and countervailing duties if applicable, customs brokerage fees, and the compliance cost of maintaining an importer-of-record bond. Each link in this chain inflates the total duty bill, and those inflation points are what separate textbook import duty calculation from real-world landed cost textile import modeling.
| Component | How It’s Calculated | Typical Range (% of FOB) | Your Leverage |
|---|---|---|---|
| MFN Duty | Ad-valorem on customs value (FOB + freight + insurance) | 5%–12% | Reclassification potential — see H2-3 |
| Section 301 Surcharge | Stacked on top of MFN for Chinese-origin goods | 7.5%–25% | Origin diversification — see H2-4 |
| Anti-Dumping / CVD | Product- and country-specific; requires separate bond | 0%–30% | Narrow — product must avoid covered scope |
| Customs Broker & Compliance | Per-entry fee + bond premium + classification filing | 0.5%–2% | Consolidation, pre-filing, broker negotiation |
| Freight & Insurance Uplift | Rerouting from alternative origins; longer transit distances | 1%–4% | Forwarder rate holds, FCL consolidation |
When you model import duty calculation this way — component by component, with ranges and leverage points — the picture becomes actionable rather than abstract. A duty rate textile 2026 increase of 5 percentage points on the headline rate might translate to only 3.5 percentage points of additional total landed cost if you can compress brokerage and logistics surcharges elsewhere. Small moves matter at the margin.
Even experienced importers routinely underestimate the secondary cost effects of a tariff regime change. These tend to fly under the radar until the quarterly P&L review surfaces an ugly surprise:
Personally, I have seen bond-increase letters and demurrage charges wipe out the savings an importer thought they secured by negotiating a 2% unit-price reduction with a new mill. Cutting the headline price is not the same as cutting total cost.
Consider a concrete example. A polyester velvet fabric — 100 Yarn Count Converter, 144 filaments per yarn, high-shiny calendered finish, bonded to a jersey backing — was originally classified under HS heading 5407.51 by US Customs. The importer accepted that classification without question for three consecutive seasons. Then, after filing a petition with reclassification arguments grounded in the fabric’s construction specifications, the same goods were placed under 5407.61. The column-1 general duty rate dropped by 2.8 percentage points. On a seasonal volume of 40,000 m (≈131,200 ft), that single reclassification saved roughly $28,000 (≈€25,900) in duties per year.
The lesson is stark: HS code textile classification is not a clerical exercise. It is a profit lever. And the technical specifications you document — denier, filament count, weave construction, finishing process — are the ammunition that makes reclassification possible.
Here is how specific technical parameters of a fabric like the High-F Shiny Velvet 100D/144F can nudge classification in one direction or another:
| Technical Spec | Parameter Value (Metric / Imperial) | Impact on HS Sub-heading | Duty Consequence |
|---|---|---|---|
| Composition | 100% polyester filament | Places fabric under Chapter 54 (synthetic filaments) rather than Chapter 55 (staple fibres) | Different base tariff line; potential 1–3% rate swing |
| Denier / Filament Count | 100D / 144F (ultra-high filament density) | Distinguishes from lower-specification classifications (e.g., 75D/36F); affects 5407.XX sub-heading selection | Rate difference of 0.8%–2.8% between adjacent sub-headings |
| Weave Construction | Warp-knit velvet | May shift from woven-fabric heading (5407) to knit-fabric heading (6001/6006) depending on bonding method | Knit headings can carry fundamentally different rates |
| Finish | High-shiny calendered | Does not change the HS chapter but can affect sub-heading notes interpretation; calendering may be presented as a value-adding processing argument | Supports petition narrative for favorable sub-heading placement |
If you are sitting on a filing where the tariff classification feels uncertain, here is a quick three-step audit you can initiate this week:
I have seen importers treat step three as optional. It is not. A binding ruling is the only classification decision that actually sticks.
When tariff walls go up, the instinct is to look for another country. That instinct is correct — but the execution is far slower and messier than most procurement teams assume when they first model supply chain diversification textile 2026 strategies. Let us start with the data and then talk about the trade-offs that the data cannot capture.
| Origin Country | Est. Stacked Duty (2026 range) | Typical Lead Time | Key Risk Factor |
|---|---|---|---|
| China | 20%–38% | 4–6 weeks | UFLPA enforcement on cotton intermediates; rising compliance documentation cost |
| Vietnam | 10%–18% | 6–9 weeks | Finishing-line capacity gaps for specialty calendering and high-filament velvet; colour-match reproducibility varies |
| Indonesia | 10%–16% | 7–10 weeks | Limited filament-fabric capacity; stronger in greige goods and commodity knits |
| Turkey | 0%–12% | 5–7 weeks | EU-biased logistics; US-facing shipments add 2–3 weeks transit; MOQs can be high for specialty finishes |
| India | 8%–15% | 6–10 weeks | Cotton-focussed ecosystem; synthetic velvet dyeing and calendering capability limited outside a handful of mills |
| Bangladesh | 0%–10% | 8–12 weeks | Primarily cut-and-sew; upstream fabric sourcing still heavily Chinese-dependent |
Now here is the nuance the table alone cannot convey. Eliminating China entirely is rarely feasible for specialty polyester fabrics. Finishing technology — calendering, electrostatic flocking, high-temperature embossing — remains concentrated in the Jiangsu and Zhejiang clusters in ways that few alternative origins have replicated at scale. A factory with an integrated weave-to-flock production chain that has been running since 2005 offers a consistency advantage that newer mills in Vietnam or Bangladesh simply have not had time to develop.
And this is where the concept of textile import regulations collides with practical capability. A product category like custom specialty finishes — calendered shinies, flocked surfaces, embossed textures — represents exactly the segment where origin pivoting becomes logistically constrained. You are not just finding a new mill. You are qualifying a new finishing line, new dyeing chemistry, and new quality-assurance calibration. That is a 12–16 week project at minimum.
For non-US importers facing a different but equally complex tariff landscape, the EU Access2Markets TARIC database provides duty benchmarks by origin country and product code, which is essential for any comparative sourcing strategy textile exercise targeting European delivery.
Not every tariff hit warrants a supply-chain overhaul. Here are three decision heuristics I recommend running before committing any procurement budget to origin diversification:
Think of this as a tier assessment: specialty products are absorb-tier; commodity products are pivot-tier. The grey zone — mid-spec fabrics with two or three potential mills — is where the real decision-making skill lies.
The spreadsheet says one thing. The factory floor often says another. Here is a case that illustrates why origin pivoting in specialty textiles is rarely smooth.
A mid-size US fashion brand — annual textile import value of approximately $8 million (≈€7.4 million) — sourced roughly 80% of its polyester velvet lining volume from a single Jiangsu mill cluster. The hero SKU: a high-filament polyester velvet with a shiny hand-feel, constructionally comparable to a 100D/144F specification. In January 2026, an HS sub-heading reclassification added approximately 7.5 percentage points in ad-valorem duty to that product. With existing net margins running at 12%–15%, the tariff increase threatened to compress profitability to single digits.
The sourcing team made the logical move: rush to qualify alternative origins. They fast-tracked a Vietnamese velvet mill first. The initial sample lot arrived within six weeks — promising on timeline. But the fabric failed ISO 105-X12 colorfastness testing at Grade 3 versus the required Grade 4 minimum. Worse, the Vietnamese supplier lacked a high-temperature calendering line, meaning the specified shiny hand-feel could not be physically reproduced. The samples were rejected.
Second attempt: an Indian supplier with calendering capability. The technical specs matched on paper. But the minimum order quantity was 5,000 m (≈16,400 ft) per colourway — triple the brand’s seasonal test-run requirement of roughly 1,500 m (≈4,920 ft). For a company working with 12–15 colourways per season, that MOQ translated to significant inventory risk and working-capital strain.
The eventual compromise was a blended sourcing split. The brand retained the Chinese supplier for roughly 60% of total volume, accepting that tariff hit as a cost of product continuity. A Turkish mill was qualified for 40% of the lighter-weight velvet variants, where calendering requirements were less specific. The Turkish goods carried a per-metre unit cost approximately 15% higher than the Chinese baseline, but consolidating ocean freight into a single FCL booking (full container load, 40-foot / 12.2 m container) partially offset the premium. Net landed cost increase was held to approximately 4.2% instead of the initially projected 7.5%.
This case involved an importer also evaluating supplier capability at mills with integrated production infrastructure similar to what the factory operating since 2005 offers — and the gap between a purpose-built finishing line and a general-purpose one proved to be the defining variable. No amount of tariff engineering compensates for a mill that physically cannot make the product.
Three lessons drawn from this trial-and-error process:
Whether you have been hit by a tariff code shift already or you are trying to get ahead of the next round, a structured 90-day plan transforms panic into process. Here is a week-by-week SOP for tariff compliance textile readiness that your procurement team can start executing immediately:
Parallel to this timeline, there are quick-win actions your team can execute in the background without waiting for sample results:
If you are evaluating whether a specific specialty-finish specification can be produced at an alternative origin without compromising performance, the best next step is to request a feasibility assessment directly. The technical inquiry form supports spec-sheet and drawing uploads, and a dedicated textile engineer responds within 24 business hours with a production-feasibility assessment and sample availability. For deeper reading on tariff compliance, finishing technology, and sourcing best practices, the knowledge hub offers a library of in-depth guides that complement those direct conversations.
China remains the single largest source, accounting for roughly 28% of total US textile and apparel import value in the most recent full-year data — down from a peak above 35% five years earlier. Vietnam has climbed to approximately 19%, followed by India at around 7%. But in specialty synthetic filament fabrics and finished polyester goods, China’s share remains well above 40%, making it functionally irreplaceable for certain product categories even as headline import statistics show diversification.
No — and the variation is dramatic across HS chapters. Finished apparel (Chapters 61–62) faces stacked effective rates of 18%–30% from China, while greige or semi-processed goods (Chapters 52–55) can range from 8%–22% depending on construction and origin. Technical textiles and industrial fabrics (Chapter 59) often carry lower base MFN rates but can be subject to specific anti-dumping orders that surge the effective rate independently of Section 301. The duty rate textile 2022 2026 landscape rewards precise product-level analysis, not blanket assumptions.
The United States is the world’s largest single-country textile and apparel importer by value, followed by the EU-27 as a bloc, then Japan and the United Kingdom. According to WTO trade statistics, the US accounts for roughly 20% of global textile and apparel import demand. This concentration of buying power is precisely why US tariff policy changes send shockwaves through global supply chains — when the largest buyer shifts its tariff wall, every origin country recalibrates.
Both — but the timing differs. A 2026 study of US apparel importers found average net margin compression of 2.5–4.0 percentage points in the first 12 months following a major tariff increase, meaning importers initially absorb most of the cost. Over 18–24 months, roughly 30%–50% of the tariff cost gets passed through to retail pricing. The US apparel consumer price index tracked a 3.2% year-over-year increase in the most recent measurement period that trade economists attribute partially to tariff pass-through. Importers who absorb without a plan eventually either raise prices or exit the product category.
The tariff landscape will keep shifting. What will not change is the principle that granular technical knowledge — of your fabrics, your HS classifications, your mill capabilities, and your full landed-cost anatomy — is your best insulation against policy shock. Start with the audit. Test your assumptions against real samples. And make pivoting decisions based on data, not headlines.